Watershed
Analysis
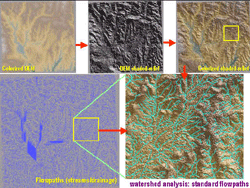
(left)A
watershed analysis was conducted. TNTmips generated a
series of themes including watershed boundaries, 'flowpaths'
(how water would flow through the terrain without consideration
for any type of land cover) creating streamlets, and drainage
basins. This picture shows the visualization process of
creating a colorized (exaggerated) shaded relief form
the DEM that was overlain by the flowpaths (streamlets).
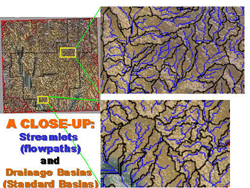
(right)TNTmips
generated 'standard basins' (streamlet-level drainage
basins) over the flowpaths and colorized shaded-relief.
A selected drainage basin can be visualized by zooming
in, while a micro-level analysis can be done. TNTmips
allows measurement of length, area, volume, etc. of the
selected site of your interest.
Landsat
7 ETM Imagery
(left)The
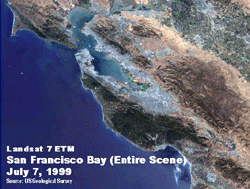
Landsat 7 ETM(Enhanced Thematic Mapper) image for San
Francisco scene was purchased from the USGA ($600/scene),
and processed (including making corrections) by Paris
& Associates, and at SIVA. The scene covers the area
from Marin County (north) to North Monterey County (South).
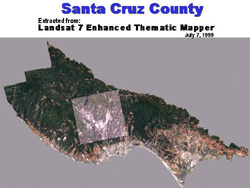
(right)The
area covering the Santa Cruz County, and the Region of
Interest (ROI) for this study was extracted out of the
processed Landsat 7. The digital information (with 7 bands)
in usable format was provided to the County of Santa Cruz
(free of charge) by BASIC.
Remote
Sensing
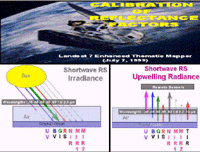
(left)The
sun light penetrate the atmosphere and reach the surface
of the earth. The sun rays travel in various wavelengths
and in different colors. While they are reflected back
to the space through the atmosphere, the Landsat 7 satellite
picks up the reflectances in seven (wave) bands. Therefore,
the Landsat 7 images received as data sets includes the
information of 7 bands. The images are of 30 meter resolution
plus a panchromatic image (black and white) in 15 meter
resolution. This is a process that calculates and calibrates
the reflectance values (factors) of each band for each
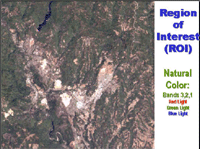
identified object on the image. (middle)By using bands
3, 2 and 1 (red, green, and blue) a natural color image
can be visualized.
(right)
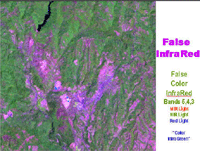
By using bands 5, 4 and 3 (mid-infrarRed), an image known
as "false InfraRed" or "Color Infra-Green"
can be generated (visualized). By using bands 3,2 and
1 (red, green, and blue) a natural color image can be
visualized. By using bands 5,4 and 3 (mid-infraRed), an
image known as "false InfraRed" or "Color
Infra-Green" can be generated (visualized).
Unsupervised
Classification
(left)
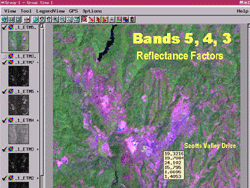
After reflectance factors were calibrated, the
data-tip on an object of the "false-InfraRed"
image shows the calibrated reflectance factors (values).
Now we are ready for further analyses using the remote
sensing techniques.
(right)
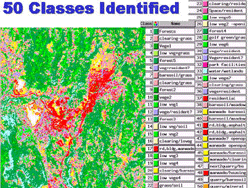
The method of "unsupervised classification"
was applied to identify the 50 different land cover classes.
The TNTmips program analyzes each pixel and averages into
one class. It automated analysis generated statistical
analyses, a dendrogram, and a scatter diagram . Each of
these 50 classes is required to identify what kind of
land cover most likely could be. The picture shows the
generic names of 50 land cover types. Note that land cover
classes are defined as relevant to the type of study (locating
potential groundwater recharge sites).
Identification
of a Class: An Example
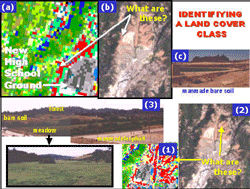 (a)
A class is highlighted in red color. (b) It was located
on the 'natural color' Landsat image. (3) A ground survey
identifies the location of this site as west of the newly
developed high school ground which was graded. This class
is noted as "manmade bare soil". (bottom-counter-clockwise)
Another example of how "baresoil", "meadow/grass",
and "mandmade/asphalt" classes were identified.
(1) One class is highlighted in red color. (2) It was
identified on the 'natural color' Landsat image. (3) The
ground-truthing indicates that the selected sites is located
west of the new high school ground. There are bare soil
on top of the knolls, a long strip of meadows, and paved
Glenwood Highway. Note that the identification of each
class was made using the aide of outcomes (statistical
analyses, dendrogram, and scatter diagram) from the Unsupervised
Classification, as well as the Digital Orho photos.
Study
Area Land Cover (11 Classes)
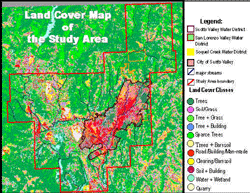 Similar
classes among 50 original classes are merged and developed
into 11 major classes that will be useful in the locating
potential rechargeable sites.
Impervious
Areas
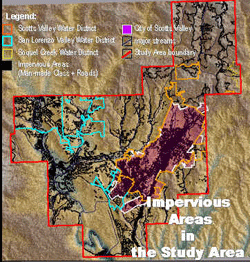 So
far, the land cover classification has been conducted in
raster format. Each class of the final 11 classes identified
are then vectorized which will allow to merge, add or subtract
with other vector objects. Now we are in the phase of identification
of impervious areas. Conceptually, it is understood that
manmade objects such as highways, roads, buildings, parking
lots, are impervious, not suitable to consider for surface
water recharge sites. Due to the nature of dense vegetation
overshadowing and/or overhanging the roads in Santa Cruz
County, the Landsat image doesn't pick up the roads especially
in the county-side. Therefore, highways, major and minor
roads (vector objects) were imported, and merged (UNIONed)
with "Manmade Impervious" class (vector object).
As a result, a vector object "Impervious Vector",
a combined 'roads' and 'manmade objects' vectors, was created.
Natural
Depressions (Basins)
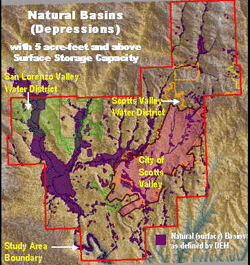 While
conducting a watershed analysis, TNTmips generated a raster
feature known as " depressionless DEM ". It is
a process that the depressions (basins) contained in the
original DEM image are filled up. The filled depressions
are depicted by ' polygons '. At the same time, the depressions
are identified by number, and the volume of each filled
depression is calculated and stored as attributes. The Cut-Fill
Analysis generated more than fifty thousand polygons for
the entire Region of Interest (ROI). A zoomed-in picture
of Quail-hollow area verifies that the depression (basin)
polygon was generated right over the quarry.
Using
the 'selection by entity' (attribute type), the depressions
(basins) with a volume of five acre-feet and above were
selected and overlain on top of the colorized shaded-relief
together with the 11 Land Cover classes. This is a visual
verification of how depression polygons are placed over
the terrain of the Region of Interest. We feel assured that
depressions are generally located in the valleys and low-lying
areas of the ROI.
The
close-up view of the quarries in the southwest of Scotts
Valley shows polygons representing basins with a volume
of more than 5 acre-feet, overlaying the quarries.
Permeable
Areas
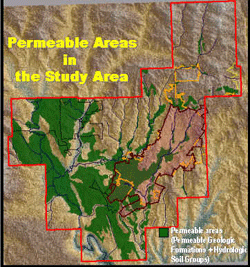 ArcView
shape files of ' Surface Geology and Soils' was imported.
The fields of geologic formations such as Santa Margarita
sandstone (Tsm), Lompico sandstone (Qal), and Alluvial deposits
(Qal) were selected as "Permeable Geologic Formations".
The permeable "Hydrologic Soil Groups" were seleceted
from the "Soils" coverage. By combining the "Permeable
Geologic Formations" and "Permeable Hydrologic
Soil Groups", a map of "Permeable Areas"
was developed.
Potential Recharge Locations
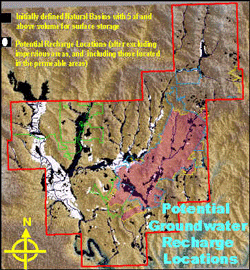 The
layer of "depressions (basins)" was laid on top
of the ' Permeable Areas '. When the two layers (vectors)
were INTERSECTed (cookie-cut), the basins, ONLY with more
than 5 af in volume (polygons) and where permeable areas
are located, were selected. We followed the process of "Identification
of Potential Rechargeable Sites" by using a "screening
or filtering" with constraining features such as impervious
areas, soils and subsurface available rechargeable space
in the aquifer. We narrowed down the areas from the initial
stage (the Study Area) by using some spatial attributes
as filters. Conceptually, it is assumed that water will
be impounded in natural basins where water can easily infiltrate
through the soils and rock formations underneath if there
is enough space available in the aquifer at a selected site.
Therefore, we looked for natural basins, then investigated
if they are located in the areas of permeable soils and
rock formations. Then, we eliminated areas where ponding
and infiltration of water are impossible.
The
layer of "depressions (basins)" was laid on top
of the ' Permeable Areas '. When the two layers (vectors)
were INTERSECTed (cookie-cut), the basins, ONLY with more
than 5 af in volume (polygons) and where permeable areas
are located, were selected. We followed the process of "Identification
of Potential Rechargeable Sites" by using a "screening
or filtering" with constraining features such as impervious
areas, soils and subsurface available rechargeable space
in the aquifer. We narrowed down the areas from the initial
stage (the Study Area) by using some spatial attributes
as filters. Conceptually, it is assumed that water will
be impounded in natural basins where water can easily infiltrate
through the soils and rock formations underneath if there
is enough space available in the aquifer at a selected site.
Therefore, we looked for natural basins, then investigated
if they are located in the areas of permeable soils and
rock formations. Then, we eliminated areas where ponding
and infiltration of water are impossible.
Potential
Groundwater Recharge Locations: A Close-up
South
Scotts Valley Region
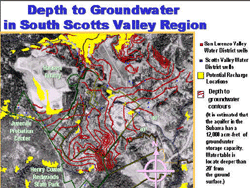 This
region is considered a critical area where artificial groundwater
recharge is in need because it is where groundwater overdrafting
continues and demand for water supplies has increased. Obviously,
what has been identified for potential groundwater recharge
locations are identified mostly by the above-surface factors.
One of the most important questions regarding the selection
of a potential recharge site is if there is enough aquifer
storage space underneath the identified potential recharge
site. To answer this question, Santa Cruz County developed
a map showing contours of equal depth to groundwater (from
the ground surface). Insufficient available well data, especially
for the northern and western parts of the Study area, precluded
preparation of a 'depth to groundwater' map for the entire
Study area. However, there are sufficient well records in
the South-Scotts Valley Sub-area. Therefore, a map was prepared
for this area. Due to the persistence of a groundwater pumping
depression, local water resources authorities have considered
the South Scotts Valley a priority area for groundwater
recharge. Computer analysis of the depth to groundwater
map conservatively estimates a volume of 12,000 acre-feet
of groundwater can be stored in the South-Scotts Valley
Subarea.
The
map shows the potential recharge locations over the 10 meter
USGS Othophoto Quad. Major rechargeable locations can be
identified by their present land uses. Two significant locations
were identified in the Hansen (former Kaiser) Quarry. Initial
assessments have indicated that the southern basin might
be beneficial to replenishing the groundwater pumping depression
area.
A
location near the present Juvenile Probation Center appears
to be another attractive area, and it has much needed open
space. Another site was located in the Valley Gardens Golf
Course area. This site indicates the existence of underlying
high permeable formations. Being located in an open space
setting, existing application of water for the greens and
ponds may have been already serving as a groundwater recharge
site. It will be beneficial for the groundwater basin if
a cooperative effort between the Golf Club and the County
(Santa margarita Groundwater Basin authorities) could be
made in evaluating the groundwater recharge potentials.
There are a few locations along the Eagle Creek and Powder
Mill Creek in the Henry Cowell Redwoods State Park, as well
as along the Carbonera Creek. Nearness to the water-bodies
such as a creek may restrict the use of these locations.
However, further investigations are recommended.
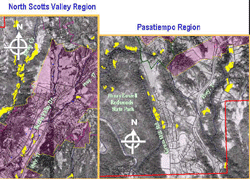 North
Scotts Valley Region
Generally, the recharge locations in the North Scotts Valley
are identified along Bean Creek, parallel to the Scotts
Valley Drive. There also are small quarry pits and Santa
Margarita sandstone outcrops on the flat and open spaces
in North Scotts Valley. They are not depicted as basins
in the Study. If excavated, these locations could also be
used as smaller recharge basins.
Pasatiempo
Region
There are two significant locations in this region. A series
of basins along the Graham Hill Road are located mostly
within the eastern edge of Henry Cowell Redwoods State Park.
Another series of basins are located along Carbonera Creek.
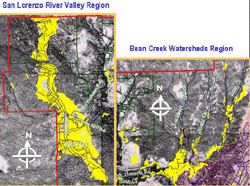 San
Lorenzo River Valley Region
The entire San Lorenzo floodplain area has been depicted
as a rechargeable location. Owing to discharge from the
San Lorenzo River, this region, in general, appears to gain
sufficient natural recharge.
Bean
Creek Watersheds Region
A series of natural basins with groundwater recharge potential
are located along the Zayante Creek, Lockhart Gulch, Ruin
Creek, and Bean Creek. Most of them may have already been
serving as natural recharge basins.
Recommendations
The following recommendations are made to the County for
further consideration: